
Compared with other passive remote sensing instruments, AIRS provides more reliable information on cloud height, temperature, and effective cloud emissivity of cirrus clouds. Previous studies have demonstrated the ability of AIRS to measure the optical and microphysical properties of optically thin cirrus clouds. AIRS can measure upwelling radiances in 2378 spectral channels, which range from 650 cm −1 to 2675 cm −1. Over the past two decades, AIRS, a high spectral resolution sensor has provided extensive information in determining a variety of atmospheric parameters. Aqua gives global, twice-daily coverage from an altitude of 705 km. Aqua crosses the equator from south to north at 1:30 PM local time (daytime) in an ascending orbit and from north to south at 1:30 AM (nighttime) in a descending orbit. Since its launch into orbit on May 4, 2002, aboard the Aqua satellite of the National Aeronautics and Space Administration (NASA), AIRS has enhanced our understanding of Earth’s weather and climate.

In this study, the high-level ice clouds were considered as cirrus clouds. The 3D_CloudFraction_OPAQ products can be used to identify the not opaque (or thin) or opaque (or thick) ice clouds. The cloud fraction phase products can distinguish the pure ice clouds from the liquid phase clouds containing supercooled liquid.

In terms of cloud top pressure and optical thickness, high clouds are classified into cirrus clouds (0 < τ < 3.6), cirrostratus clouds (3.6 < τ < 23), and deep convective clouds (23 < τ < 379) on the basis of the ISCCP scheme. The 3D_CloudFraction_phase products contain the liquid, ice, and uncertain cloud phase fraction profiles, while the 3D_CloudFraction_OPAQ products include the opaque and nonopaque (or thin) cloud fraction profiles. The MapLowMidHighphase products contain the liquid cloud cover, ice cloud cover, and undefined phase cloud cover at low level ( (∼3.36 km)), midlevel, and high level ( (∼6.72 km)) following International Satellite Cloud Climatology Project (ISCCP) definition. In this study, the monthly average MapLowMidHighphase, 3D_CloudFraction_phase, and 3D_CloudFraction_OPAQ products (V 3.1.2) at 1° × 1° grid for 11 years (2007–2017) were used. The CALIPSO-GOCCP products have been widely used for the study of cloud distribution and model evaluation. The CALIPSO-GOCCP products include the monthly mean day, night, and averaged cloud fraction data. Monthly cloud fractions are then computed by accumulating cloudy profiles during one month for each longitude-latitude grid box (e.g., 1 × 1°). The CALIPSO-GOCCP cloud phase detection algorithm and related evaluation were described in detail by Cesana and Chepfer.

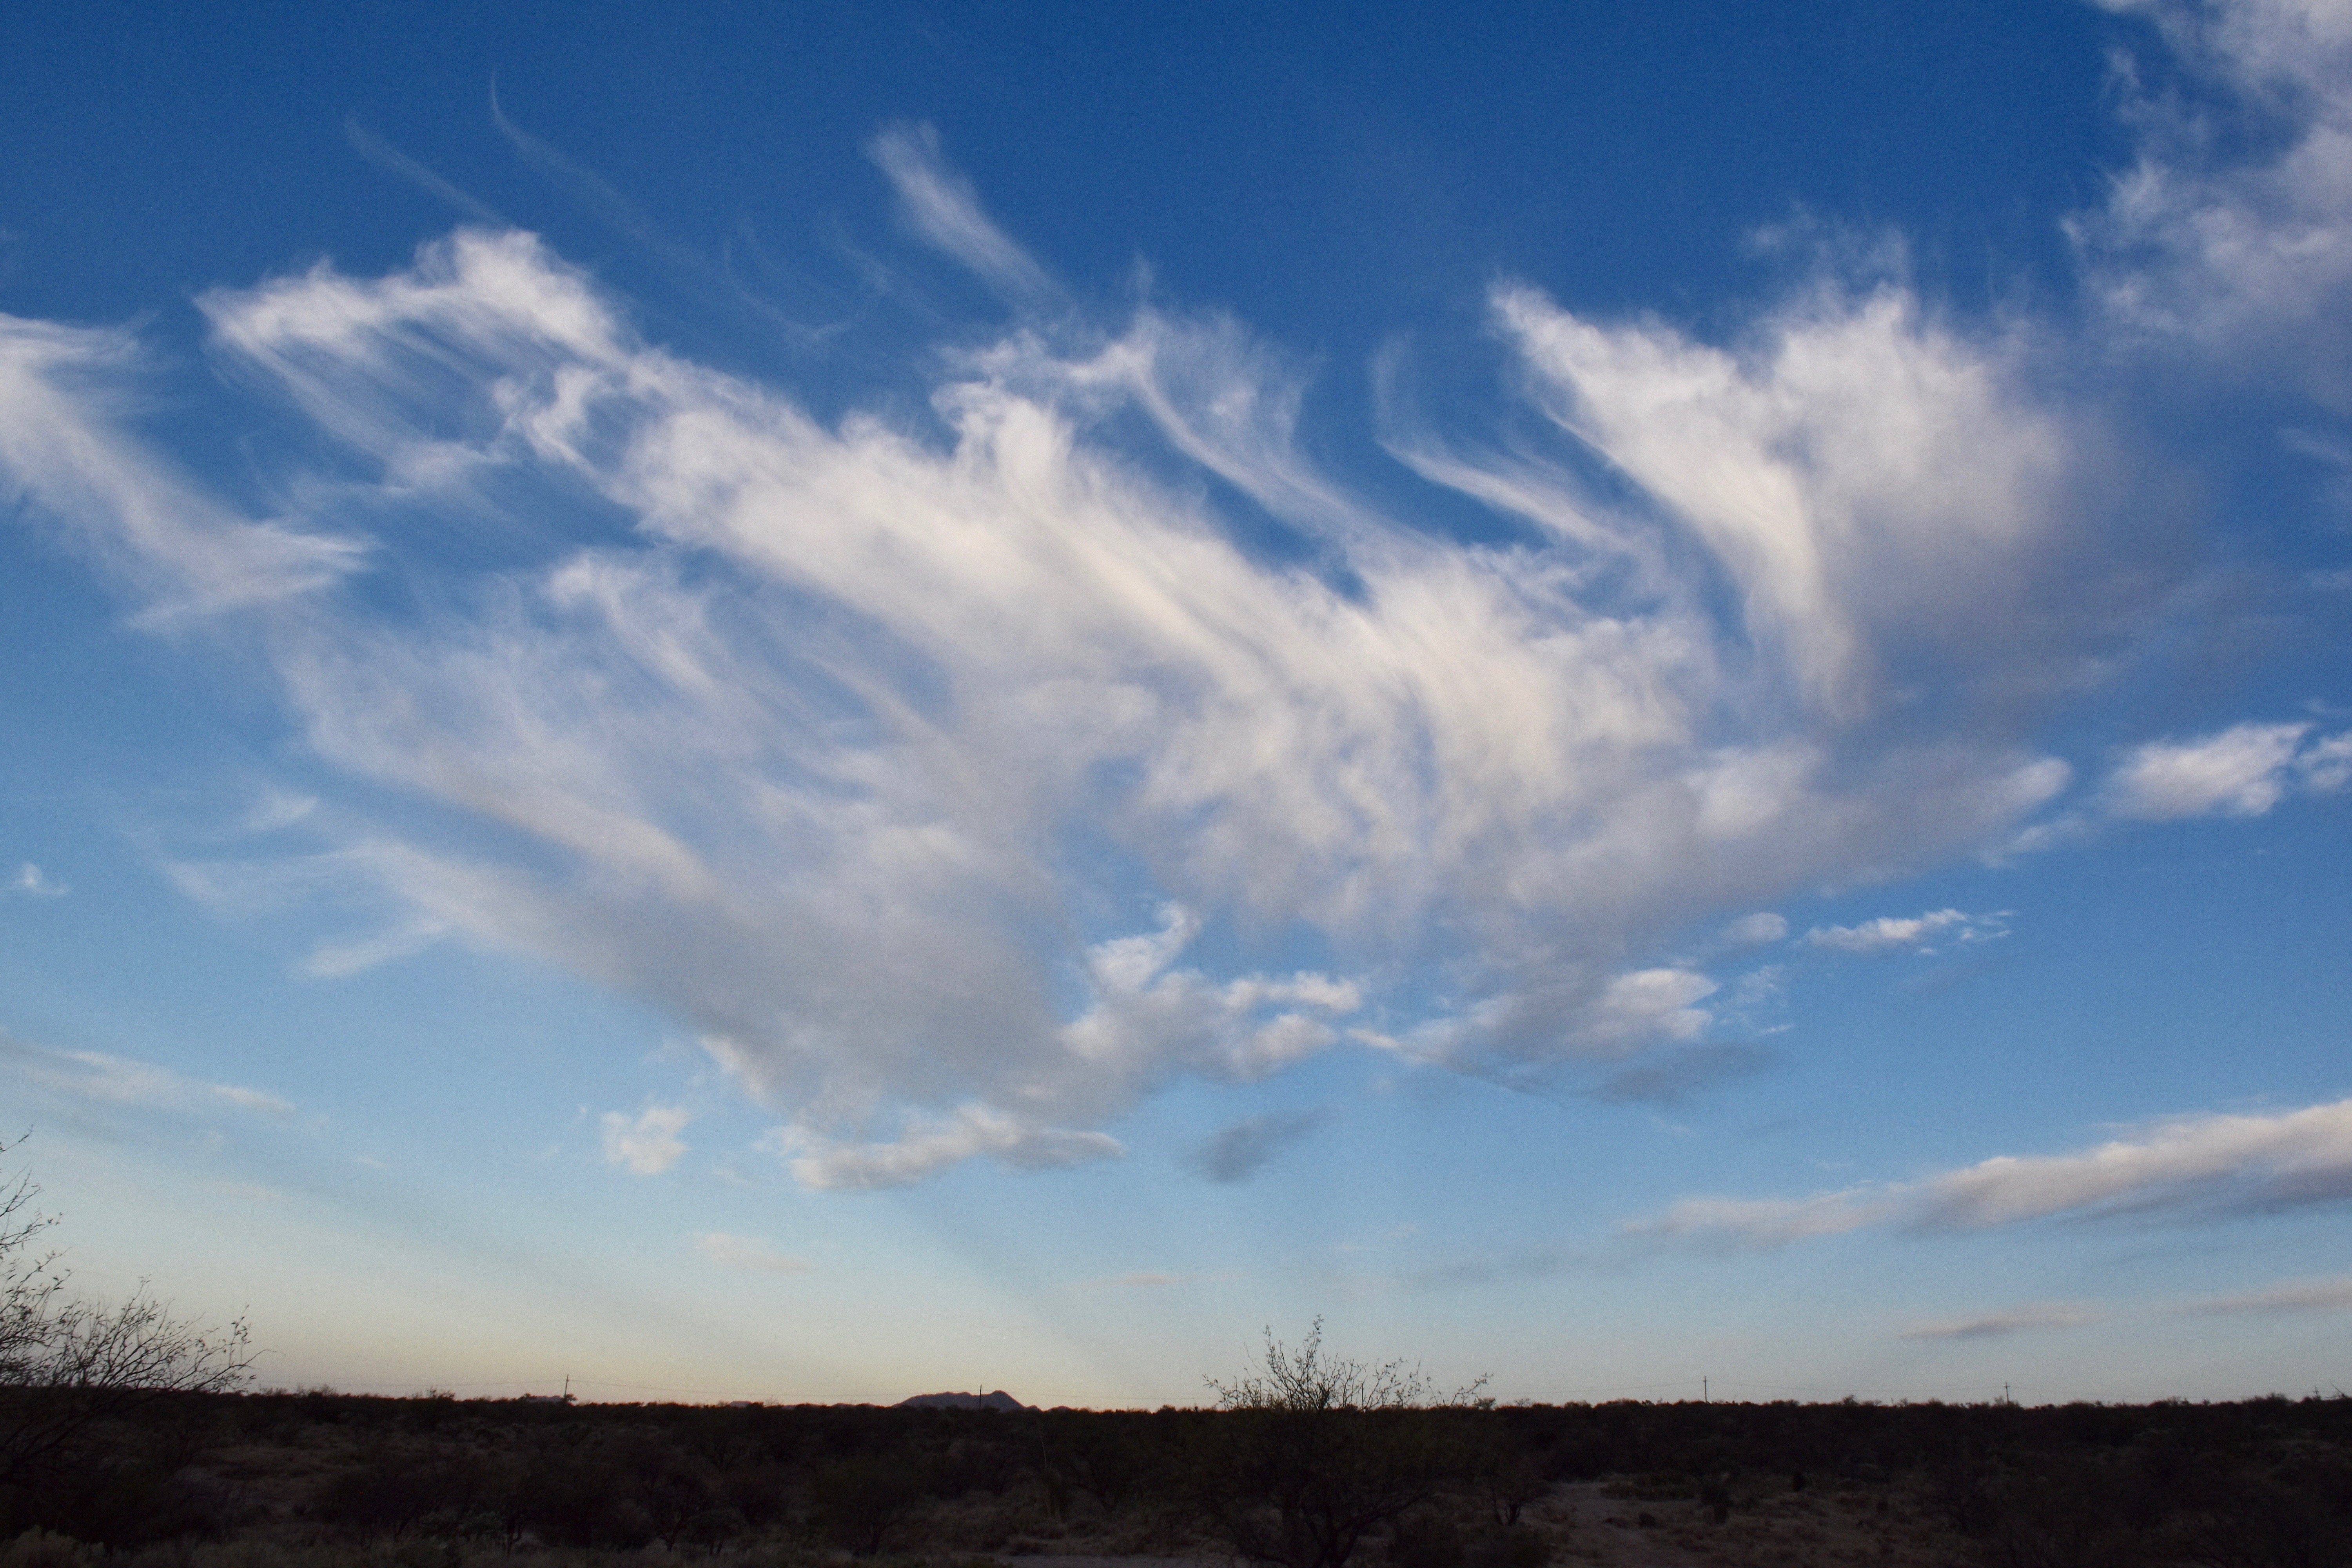
The cloudy profiles at each layer are then classified as liquid, ice, or undefined phase clouds using the polarization state of laser light scattered by the cloud particles (multiple scattering was considered) and temperature. IntroductionĬirrus clouds are thin, wispy clouds that are generally located in the upper troposphere and lower stratosphere (cloud top pressure 5), fully attenuated (SR < 0.01), or unclassified (1.2 < SR < 5) to avoid false cloud detection in the upper troposphere and lower stratosphere. Moreover, the high clouds below 11 km are dominated by opaque clouds, while the nonopaque (or thin) and opaque (or thick) clouds above 11 km are comparable. Cirrus clouds over the northern and central TP may be relevant to the atmospheric lift by an approaching cold front and topographic lifting. The ice clouds in the southern TP are associated with plateau deep convection activities and abundant vapor transmitted by the Asian monsoon. The cirrus clouds over the southern TP were relatively high (located in 10–17 km) and manifested northward and southward movements. From June to August, cirrus clouds mainly occurred in the southern part of the TP during summer. From January to May, cirrus clouds mainly occurred in the central and northern parts of the TP (30° to 40°N), and the cirrus cloud fraction increased from January and reached its maximum (∼0.51) in April. One was located in the regions from the equator to 25°N, and the other was within the latitude belt from 30° to 40°N. There were two distinct areas with the high occurrence of cirrus clouds in the area (0°–60°N, 75°–103☎). The high clouds over the TP are dominated by cirrus and show seasonal variation characteristics. The spatial and temporal distribution characteristics of high clouds over the Tibetan Plateau (TP) were studied using the Atmospheric Infrared Sounder (AIRS) and the GCM-Oriented CALIPSO Cloud Product (CALIPSO-GOCCP) monthly mean cloud products from 2007 to 2017.


 0 kommentar(er)
